Visualizing AI startups in drug discovery
(Image source: Analytics Insight)
As a machine learning researcher in the biology field, I have been keeping an eye on the recently emerging field of AI in drug discovery. Living in Toronto myself, where many “star” companies in this field were founded (Atomwise, BenchSci, Cyclica, Deep Genomics, ProteinQure… just to name a few!), I talked to many people in this field, and attended a few meetup events about this topic. What I learned is that this field is growing at such a rapid speed, and it is becoming increasing hard to keep track of all companies in this field and get a comprehensive view of them. Therefore, I decide to use my data science skills to track and analyze the companies in this field, and build an interactive dashboard (click here if you can’t wait till the end of this post!) to visualize some key insights from my analysis.
(This article was also published on Towards Data Science.)
Dataset
The Chief Strategy Officer of BenchSci (one of the “star” AI-drug startups in Toronto), Simon Smith, is an excellent observer and communicator in the AI-drug discovery field. I have been following his podcast and blog about industry trends and new companies. He wroted a blog in 2017 listing all startups in AI-drug discovery field, and has been updating this list since then. This blog is what I have found to be the most comprehensive list of companies in this field (230 startups as of April 2020), and therefore I decided to use his blog as my main data source.
Data Preprocessing
Since the blog simply listed companies as different paragraphs, I first scraped company information from the blog using Beautiful Soup. Then, I converted the scraped data into DataFrame format using Pandas. The dataframe looks like this:
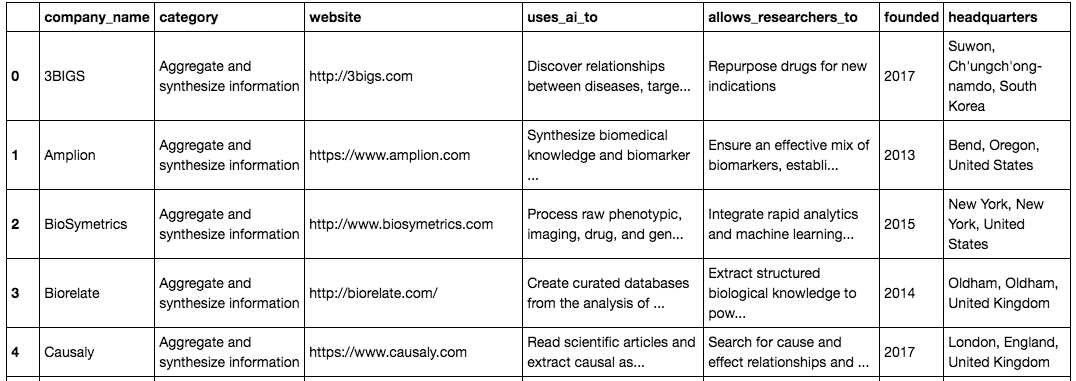
In order to visualize these companies’ locations in a map, I converted the address information in this table to latitude and longtitude using Geopy:
# match address to latitude and longitude.
from geopy.geocoders import Nominatim
locator = Nominatim(user_agent="ai_drug")
lat, lng = [], []

for i, row in df.iterrows():
    location = locator.geocode(row.headquarters) or locator.geocode(row.city+','+row.country)
    lat.append(location.latitude)
    lng.append(location.longitude)

df['latitude'] = lat
df['longitude'] = lng
The funding information about these startups are not in the blog, therefore I searched for all 230 companies on crunchbase and pitchbook, and added these information to my dataset too.
Exploratory Data Analysis
I did some exploratory data analysis of the cleaned dataset, and noticed a few interesting things.
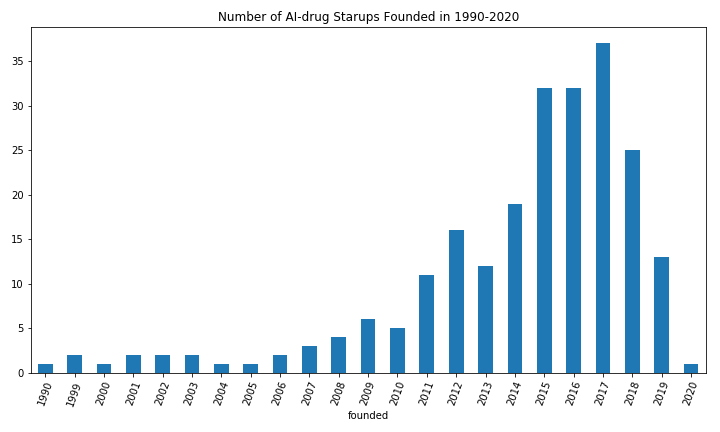
1. Explosion of startups since 2010
We can see this area didn’t really start existing until 1999. Schrödinger, the company that devolops chemical simulation software, was founded in 1990 and listed here, but I am not sure if their drug discovery platform has already started using AI in 1990… The explosion of startups started in post-2010 era, around the same time when the “AI-hype” started, and peaked in 2017.
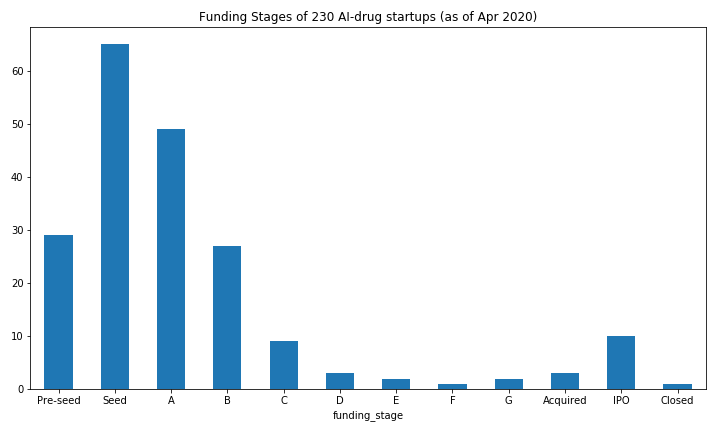
2. Most VC fundings are early-stage
We can see the majority of companies that received funding are still in early stages of venture capital funding (Pre-seed to Series A), which might be due to the fact that most AI-drug startups are still at the stage of exploring business models and developing technologies and products rather than scaling the company size.
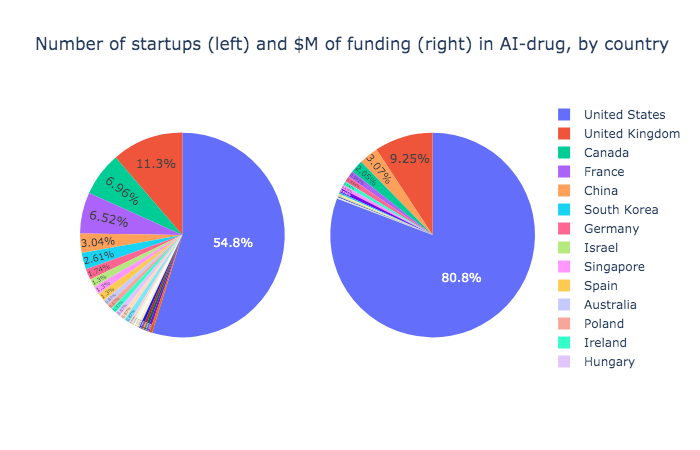
3. US is dominating the rest of the world
This may not come as a surprise, but US is dominating the rest of the world in this field. More than half of the companies are headquartered in US; More than 80% of the VC money went to US startups! UK is the No. 2 both in number of companies and funding. Canada is the No. 3 in number of companies, but not in funding - China is. There are quite a few promising Chinese startups in this field. For example, Adagene, an antibody discovery & development company in Suzhou, just raised $69,000,000 D-series funding in January 2020.
4. Novel drug candidate generation is the focus area of AI usage
We can see that the R&D category that attracts most attention and funding is the generation of novel drug candidates. Personally, I also thinks this is where AI can achieves its most power, i.e. predicting target-drug interactions using machine learning, by leveraging the large amount of existing test data.

Interactive Dashboard
I used Plotly Dash to build an interactive dashboard to visualize my dataset and deliver analysis insights. Dash is Python-based framework for building analytical web applications, and it’s free! The completed dashboard can be viewed at https://ai-drug-dash.herokuapp.com/, and you also can check out the code in my GitHub repo.
How to use this dashboard?
First, choose an visualization metric from the top left control panel. You can use either the number of companies, or the amount of investment in all visualization plots.
Next, choose a region or countries. This can be done either by selecting from the control panel, or by clicking/box selection in the map plot (to reset your selection, click empty spot in the map).
Finally, choose a R&D category. This can be done either by selection from the control panel, or by clicking a bar in the bottom-left category plot, which will also update the keyword graph for this category. The company information table in the middle will also update with these selections, so that you can narrow down your company list for research.
Have fun!

References:
[1] Simon Smith, 230 Startups Using Artificial Intelligence in Drug Discovery. https://blog.benchsci.com/startups-using-artificial-intelligence-in-drug-discovery#understand_mechanisms_of_disease
[2] https://www.crunchbase.com/
[3] https://pitchbook.com/
[4] David Comfort, How to Build a Reporting Dashboard using Dash and Plotly. https://towardsdatascience.com/how-to-build-a-complex-reporting-dashboard-using-dash-and-plotl-4f4257c18a7f